
Reading the overview
Available per day, income allocation, budgets to watch.
The home screen answers one question: how much can still be spent before the cycle ends.
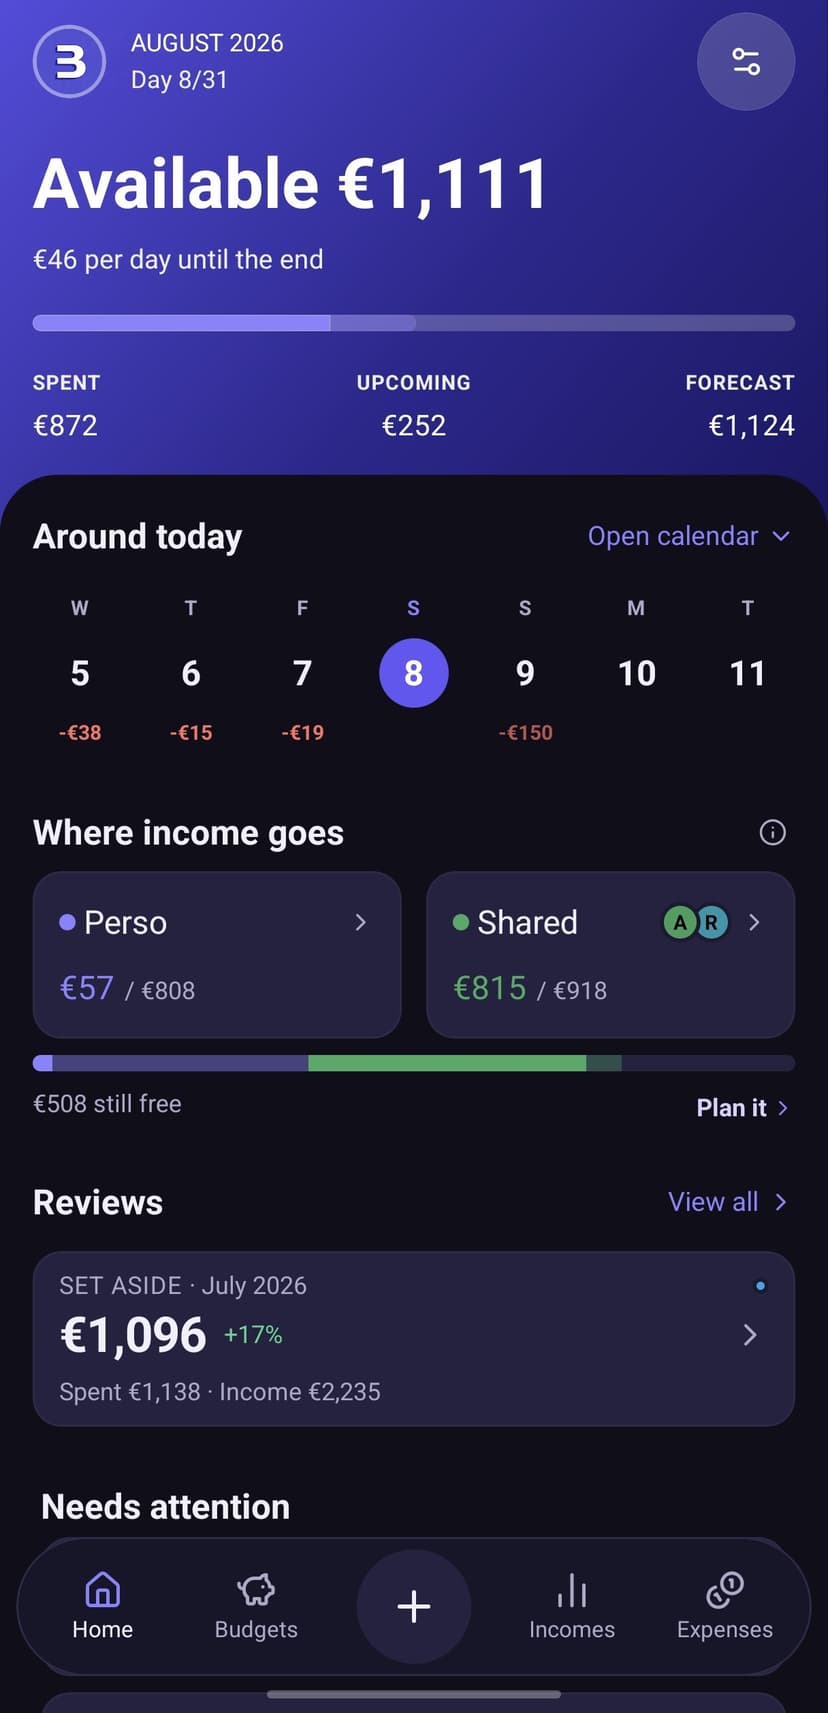
The cycle banner
At the top, the amount available per day until the end of the cycle, with your position in it — "Day 12/30".
Three possible states:
| State | What it says |
|---|---|
| On track | The current pace holds to the end |
| Tight | The forecast is closing in on the cycle's income |
| Over budget | The forecast exceeds the cycle's income |
The bar separates four things: what is spent, what is upcoming, the forecast and the available amount.
The calculation starts from the cycle's income, not from budget objectives. With no income recorded, the banner says "No income this month" rather than inventing a figure.
Personal and Shared
Two separate blocks. Each shows spent against planned, the number of budgets, and how many of them have no objective.
The shared block also shows who with, and who spent.
Income allocation
A bar showing how much room budget objectives take in the cycle's income. The solid part is already spent, the light part still available.
The Free segment is what is attached to no budget: to keep in reserve or to plan into a new budget.
If objectives exceed income, a badge states by how much.
Recent activity
A strip of the last few days, with amounts spent and received. It unfolds into the month's calendar: each day carries an intensity based on what was spent, and opens to show the detail.
The reading toggles between Total and Personal.
To watch
Budgets whose trajectory is a problem over the period. If there is nothing, the screen says so: "Nothing worrying in this period."
The other cards
- Recent budgets — latest updates
- Debts summary — "You are owed", "You owe", or "All settled"
- Reports — the report for the closed period